Field of expertise:
Methods:
Application area:
Injection Moulding| Product Quality and Reliability| Production| Sensors and Detection
Industry:
Owner: Cavity Eye Hungary Kft. | Publication date: 2024
In-cavity pressure sensors help to understand what is happening in the cavities. Based on the data they provide, we can compare pressure profiles for multi-cavity molds, infer product quality, and monitor pressure drops in the cavities. All things considered, with the sensors the process consistency and the machine independent injection molding process can be reached.
In the simulation environment provided by Moldex3D, we can place probe points to extract data, such as pressure, at specific locations, thereby using them as virtual pressure sensors. This allows for comparison between measured real-world data and simulated data.
Challenges
In order to obtain accurate results from the Moldex3D simulation, it is important to consider the following:
- Choose an appropriate material card with detailed measurement results, whose properties match reality.
- Perform the simulation with precise part and mold geometries (including sprue, runners, cooling channels, and inserts).
- Take into account the properties of the injection molding machine during the simulation.
- Use accurate process parameters.
- Create a high-quality, appropriate type of mesh.
Engineering solution
Using the Moldex3D injection molding simulation software, we examined a two-cavity mold suitable for producing 1BA test specimens, with pressure sensors located at the end of the flow path and the gate.
The mesh of the product is BLM mesh (boundary layer mesh). In boundary layers, where significant changes are observed, using prism elements is recommended. Due to the complexity typical of injection-molded parts, using a tetrahedral mesh inside the part is advisable. For the runner system using a structured hexahedral mesh is the best choice, regarding quality, element number, calculation time and result precision.
After setting the proper simulation parameters and the mesh, it is clearly visible on the cavity pressure curves, that there is no significant pressure difference between the real life measurement and simulated results. The dotted lines represent the real characteristic curves, while the dashed lines show the simulated characteristic curves.
Benefits
Moldex3D offers the following advantages to users:
- Probe points can be placed, and after aligning their position with sensor position, the simulation data can be used in both design and operation. Optimization of injection molding parameters is possible based on simulated cavity pressure curves.
- As the case study outlined, with proper pre-processing, the simulation results (like pressure curves) come very close to reality. This can help in further choices for design or process.
- For material selection, Moldex3D provides a large material database, and there is also the option to add custom materials.
- It has a database of numerous manufacturers’ injection molding machines, which aids in setting the appropriate parameters.
- It features advanced 3D meshing technology that employs the Boundary Layer Mesh (BLM) method.
- It can identify issues before actual tool manufacturing, thus reducing costs.
- By repeating the simulated pressure results on the injection moulding machine with a cavity pressure measurement system, we can get the right quality parts – regarding to dimensional accuracy, warpage and shrinkage.
- Setting up ideal process settings on the injection molding machine is very quick – we just need to repeat the simulated cavity pressure curves.
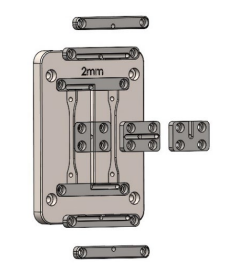
Tool design – schematic
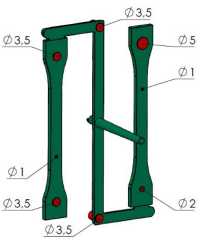
Sensor positions

Simulation model and “virtual” measuring nodes in Moldex3D
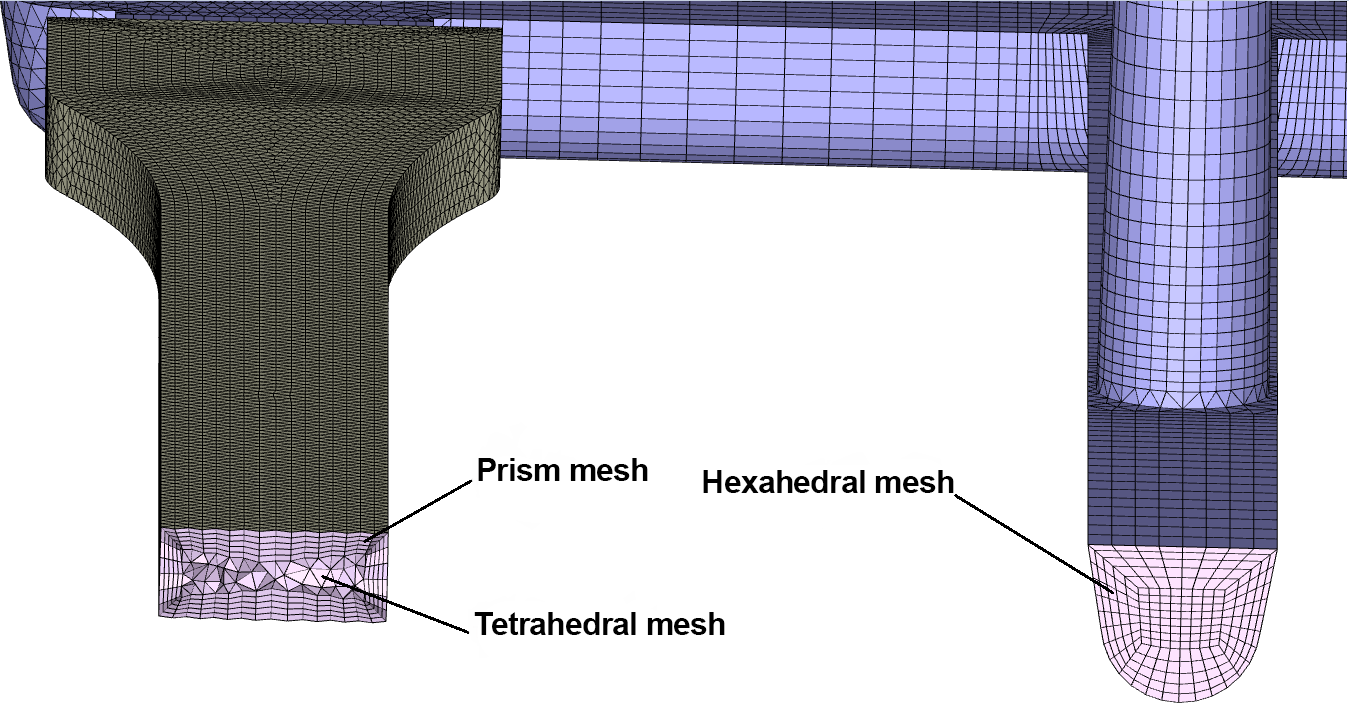
Mesh of part and runner system
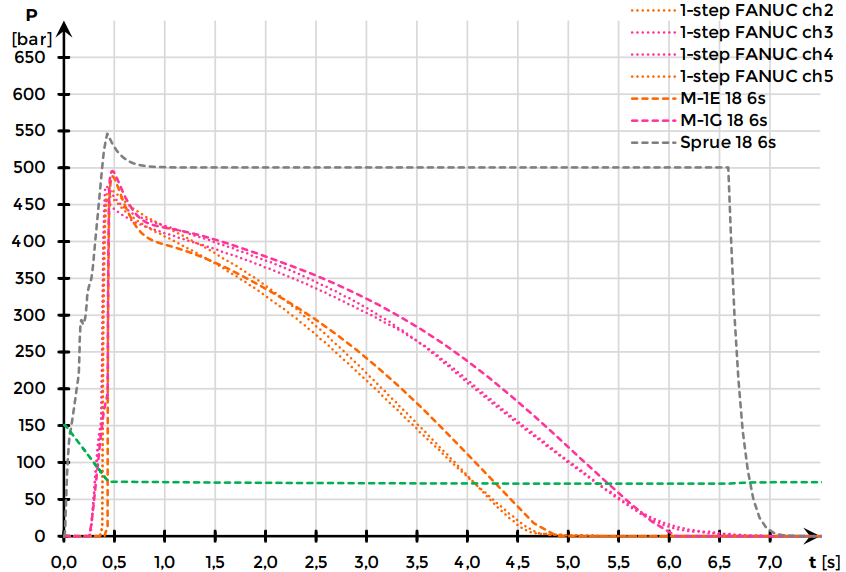
Measured and simulated pressure curves – comparison
